Complex Data Made Visible
Client
Goldman Sachs Research
Year
2020
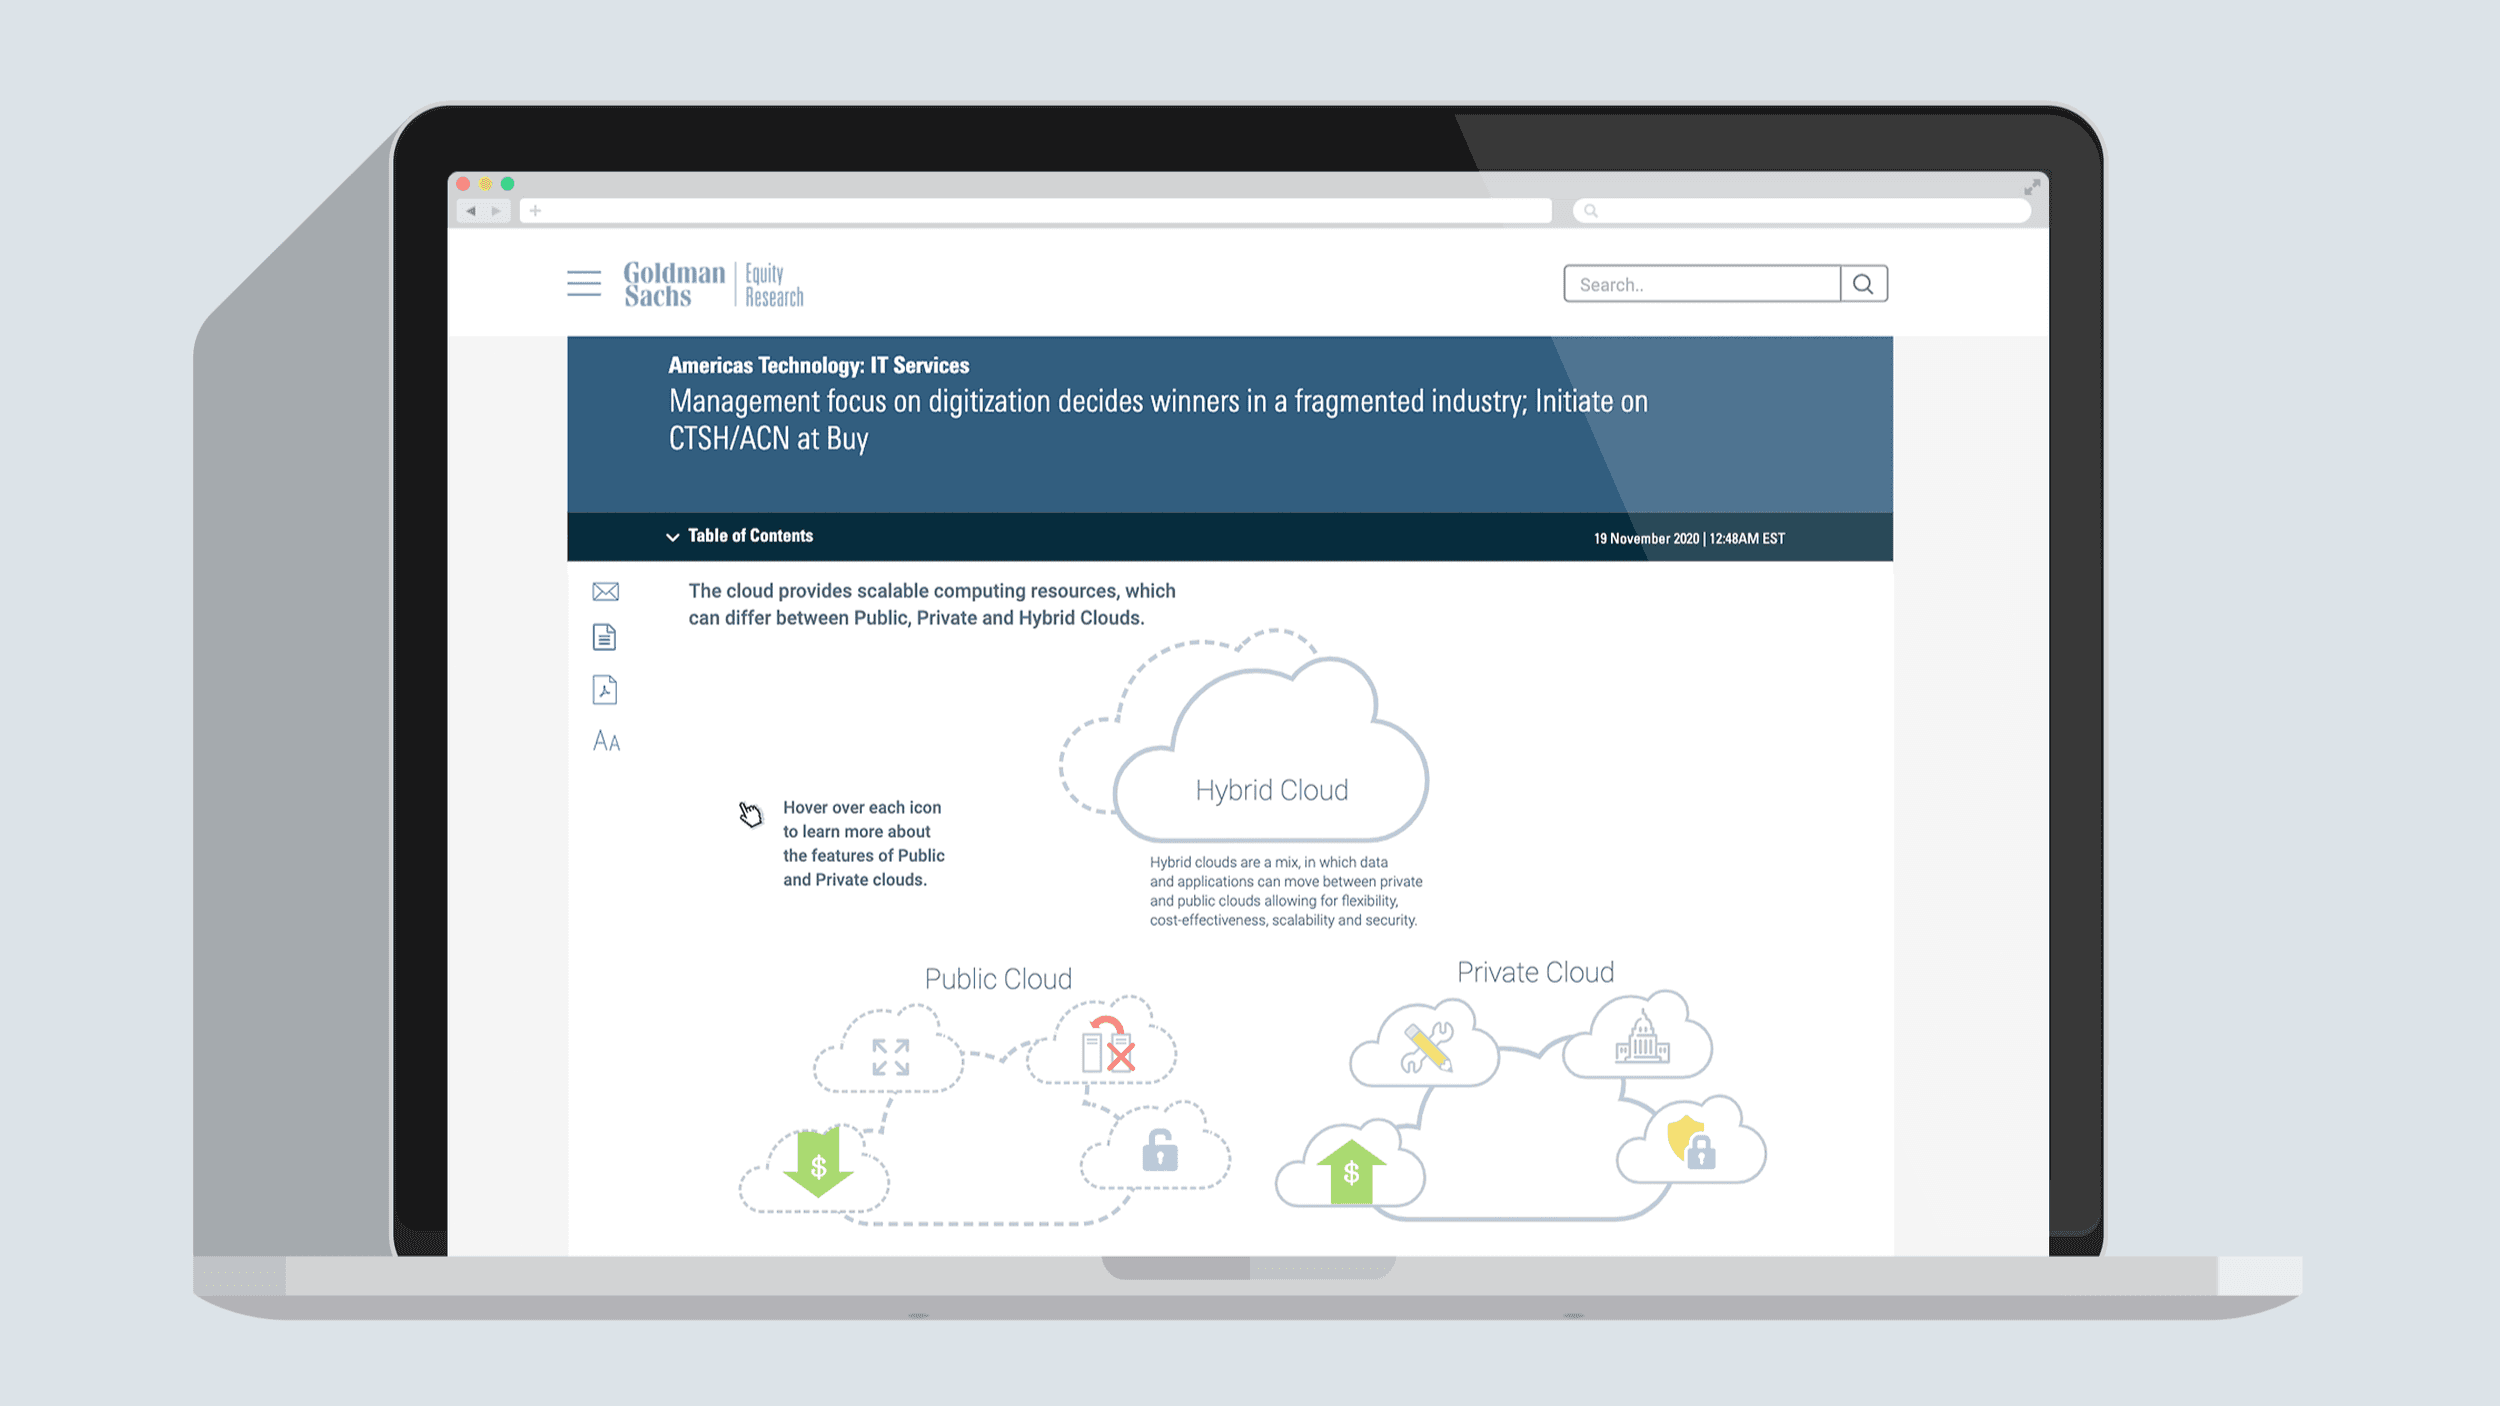
The Global Investment Research division of Goldman Sachs wanted to add interactivity to its research reports. I turned complex data into engaging, interactive stories on the Research Portal. I consulted with Managing Directors at the firm, then designed and developed Scalable Vector Graphics.
The Visuals I brought to Goldman Sachs enhanced the research experience and reflected the firm's commitment to insightful investment research.
Art Direction
Consulting
Developing and Designing custom SVG interactive visualizations.

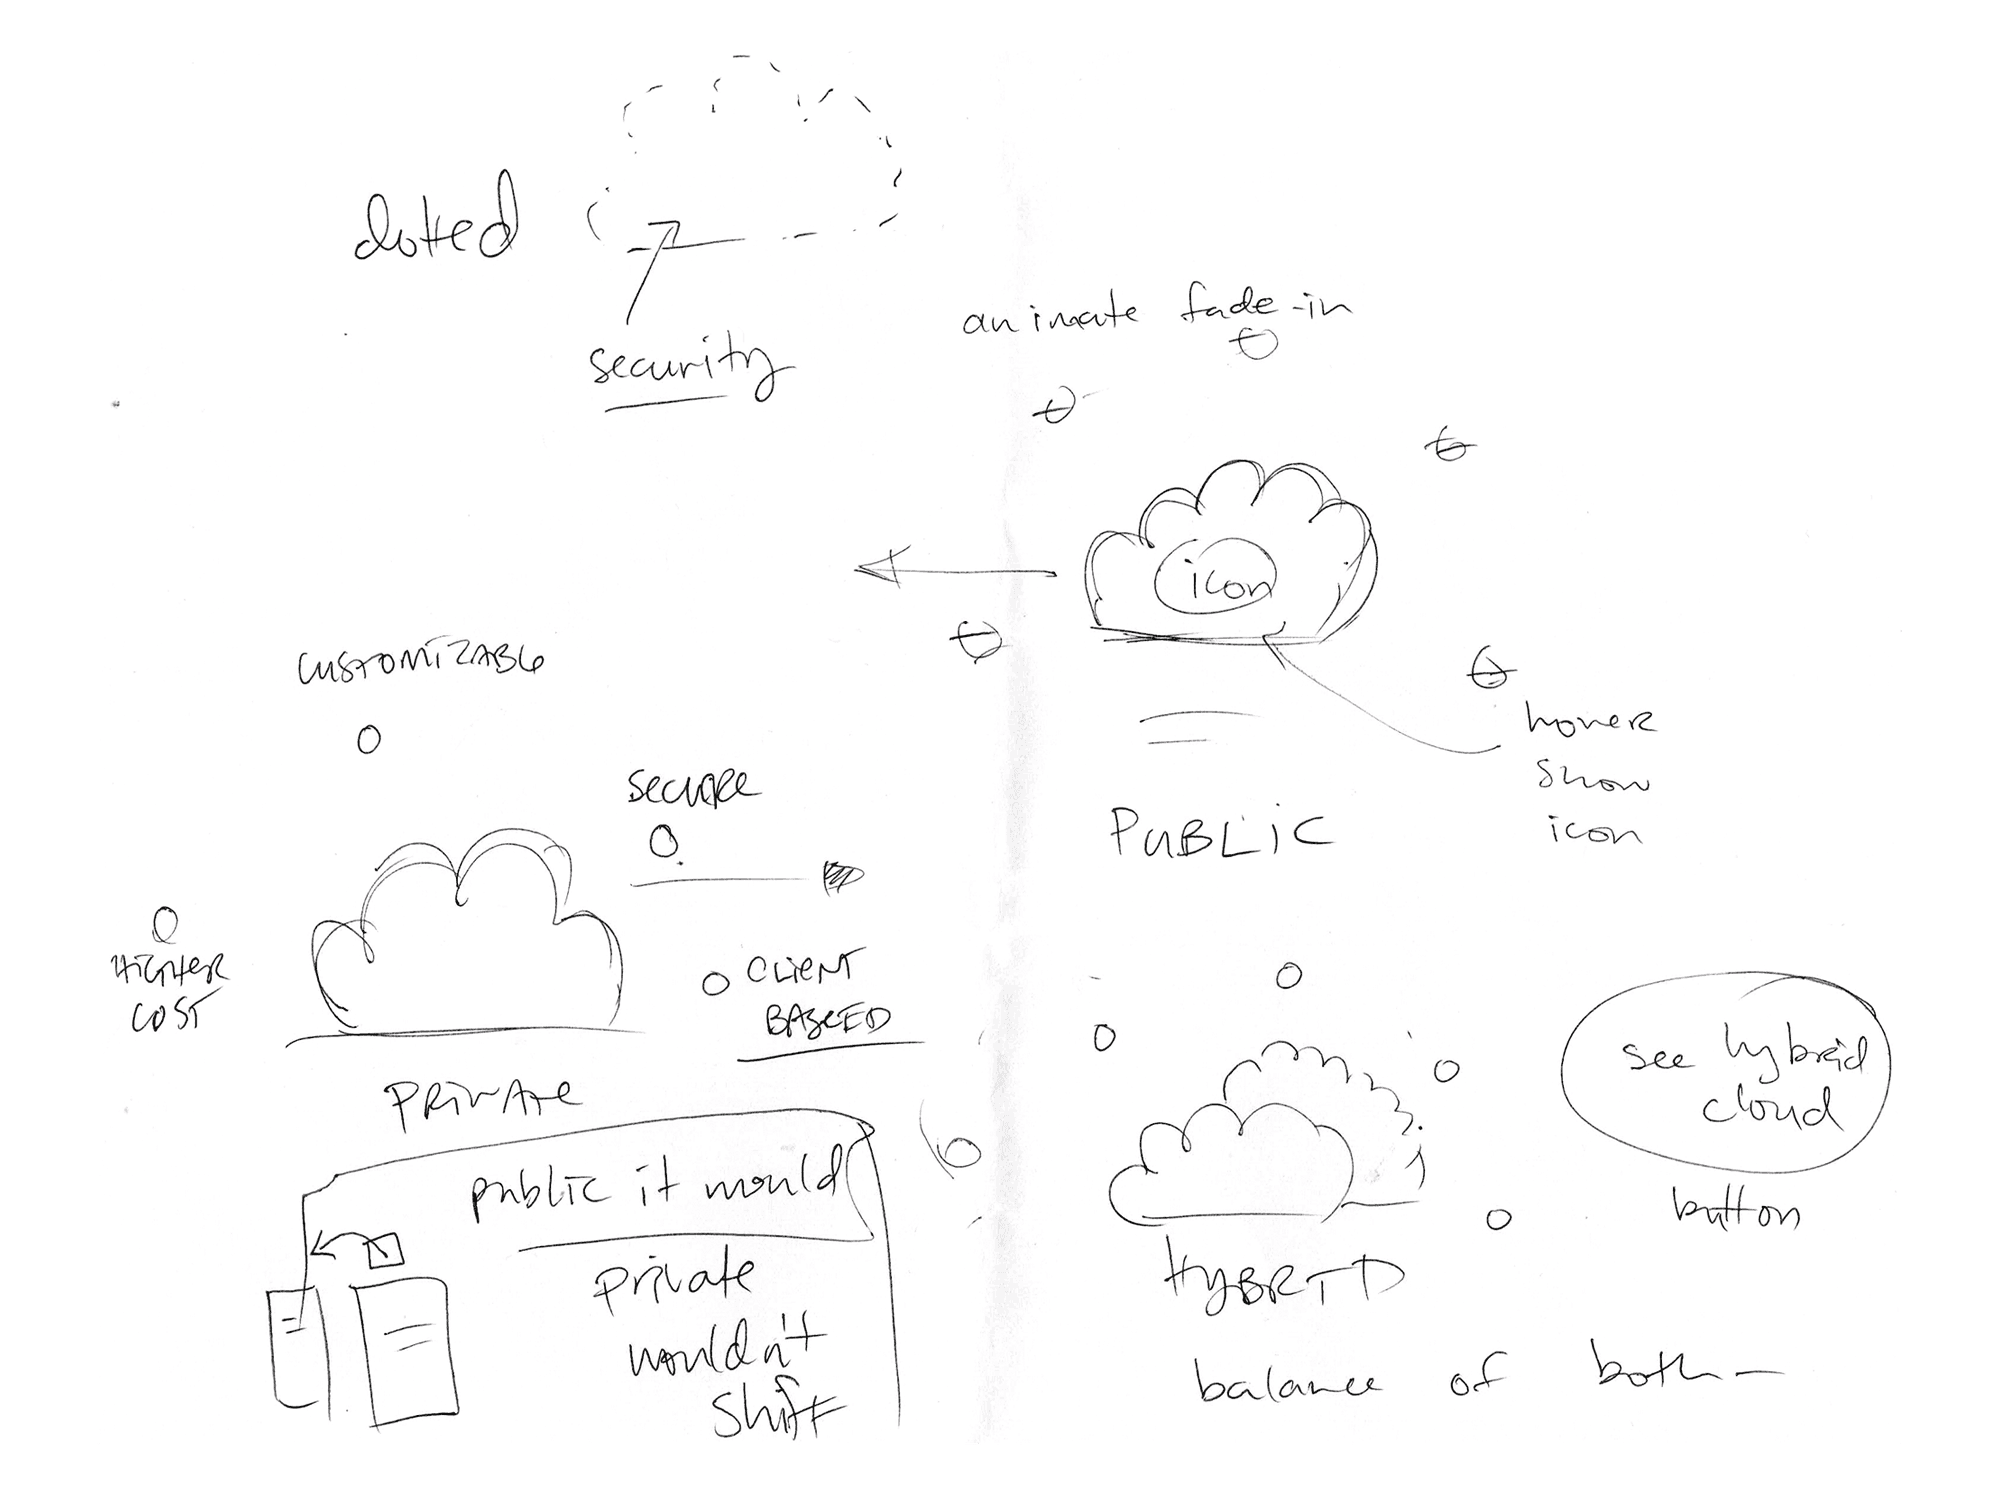
For the Hybrid cloud graphic, I drew sketches while consulting with the Managing Director, who was writing the article. This helped clarify the vision before I started the animation.
The published graphic to explain the Hybrid Cloud concept to readers.
